Save Time Customizing Excel Formats
Learn How to Save and Reuse Custom Chart Formats in Excel
Several customers have said: I'd like to use a different format for some of the charts I produce. I don't want to have to redo it all manually every time. GOOD NEWS!
- QI Macros have this feature built into our Chart menu under Remember and Apply Chart Formats
- If you don't have QI Macros, but have Excel 2007 and later versions, you can save a chart format to a template and then apply it to any future chart.
Here's How to Save and Reuse a Chart Format
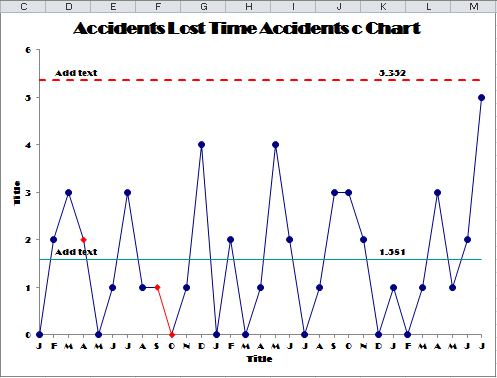
Once you've drawn a chart, you can change the formatting of the lines, fonts, colors, whatever you want. In this example, I've changed a c Chart to use Broadway font and other colors.
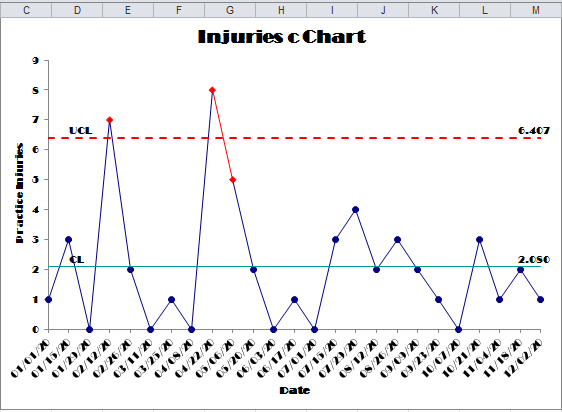
If I then click on Chart Tools - Design - Save as Template and give it a name like c Chart.ctrx, I can then access this format later.
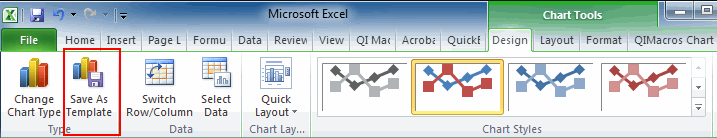
Then I can reuse this template everytime I draw a c Chart.
Applying the Template to a New Chart
So, if I draw another c Chart...
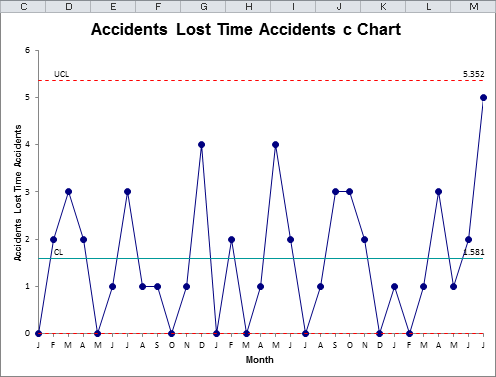
And then click on Chart Tools - Design - Change Chart Type and select Templates-c Chart:
Excel will reapply all of the formating changes in the template:
Pretty slick huh?
Warnings: This should work for most of the charts except those that use Error Bars. QI Macros charts that use error bars are:
- XbarR, XbarS, XMedianR
- p and u charts
- Box and Whisker
Workaround for QI Macros charts that use error bars:
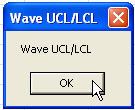
If you switch the control chart format to "Wave", the X, p and u charts will use normal formatting that can be modified by this technique. Click on Control Charts (SPC) -> Control Chart Rules -> p/u UCL/LCL Format to get the "Wave" format:

Tarpits: I found out the hard way that Excel will remember EVERYTHING about the chart format! It will remember red out-of-control points and lines on control charts and change those points red anytime you apply the format. So you might want to use QI Macros Chart Menu -> Clear Stability Analysis before saving the template.
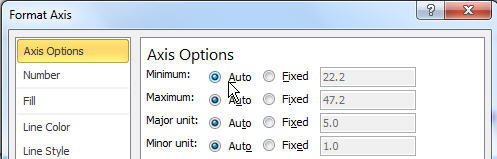
Also, make sure the axis options are set to auto, not a fixed value. Otherwise, when you apply the format your chart may vanish because the data is below the fixed limit (22.2):
Other Charts Included in QI Macros for Excel
Join 100,000+ Users
in 80 Countries
![]()
